Discord Analytics for Big Companies: Why Your Twitter Playbook Doesn't Work (and What Does)

By Louisa Lu — Founder, CommunityOne
Building Discord-native growth tools for brands since 2021. Analysis based on aggregated data across 10K+ Discord servers using CommunityOne.
Key Takeaways
- Discord's value is often misunderstood by leadership because traditional social media analytics metrics (like total members, reach, and engagement rate) don't accurately reflect its "relationship mesh" structure.
- Instead of broadcast metrics, focus on metrics that measure depth of recurring interaction, such as 5-minute and 7-day chat retention for new joiners, and "super fans" (active contributors).
- 5-minute retention indicates how quickly new members are engaged, while 7-day retention mirrors product analytics' D7 retention, showing long-term interest.
- "Super fans" represent the active contributor base, with a healthy benchmark of over 4 messages per member per week, signifying significant voluntary attention.
- By reporting these relevant Discord metrics, teams can demonstrate the channel's true business impact, connecting it to retention, revenue, and product adoption.
TL;DR: Shift from vanity social media metrics to deep engagement and retention analytics to prove Discord's value to leadership and connect it to business outcomes.
A brand we work with recently celebrated hitting 50,000 Discord members. The CMO smiled. The CFO asked, politely, what that meant. The head of product asked, less politely, what they were supposed to do with it. Nobody had a good answer.
Get every Discord analytics metric in this post — 5-minute retention, super fans, conversation depth, plus the Discord-to-product ID join — out of the box.
✨ Invite our botThis is the quiet failure mode of Discord at scale inside large organizations. The channel works. The community shows up. But the metrics being reported up the chain are the wrong shape, so leadership sees a vanity number and the team can't connect Discord to anything that matters — retention, revenue, product adoption.
The root cause is that every analytics framework in the building was built for broadcast media. Twitter, Instagram, paid ads, even your owned blog — they all reduce to a funnel: impression → click → conversion. Discord is not that shape. So when you report Discord like it's Twitter, you produce numbers that are either inflated and unactionable or so disconnected from the business that the channel gets underinvested in.
By the end of this post, you'll have: the five Discord metrics that actually belong in your KPI, the one ultimate metric that ties Discord directly to product adoption, and a clean answer to the next executive who asks "what's our Discord even doing for us?"
Why Discord Analytics Doesn't Look Like Social Media Analytics
The architectural difference is one sentence:
" Twitter, Instagram, and TikTok are broadcast graphs. Discord is a relationship mesh."
A broadcast graph is one-to-many. You publish, an algorithm decides who sees it, and audiences mostly observe. The natural metrics are reach, impressions, and click-through — all proxies for attention captured. That's why every social analytics product on earth converges on the same dashboard: posts on top, engagement rate next to them, follower trend on the right.
A relationship mesh is many-to-many. Members talk to each other, persistently, across channels and threads, with no algorithmic gatekeeper. The natural metrics here are about depth of recurring interaction — who's talking to whom, how often, how substantively, and whether they keep coming back.
This matters more in a large organization than at a startup, for one specific reason: the bigger the company, the more muscle memory there is around the broadcast funnel. Five years of marketing reports trained on impressions and CTR don't unlearn themselves. So when Discord lands on the same dashboard, two failure modes show up:
- Inflated vanity numbers that no one downstream can act on. "We grew to 50K members" tells your performance marketing team nothing about whether to spend more. It tells the product team nothing about what to ship next.
- Underinvestment, because the metrics that would prove the channel works aren't being reported. Discord's actual value lives in numbers your team isn't surfacing, so the channel never builds the case for its own budget.
The fix isn't a better dashboard. It's a different mental model — and a different five metrics on the slide.
5 Social Media Metrics That Mislead Your Discord Analytics Reporting
Before we get to what should be on the slide, let's name what shouldn't. These five numbers are useful on Twitter and dangerous on Discord.
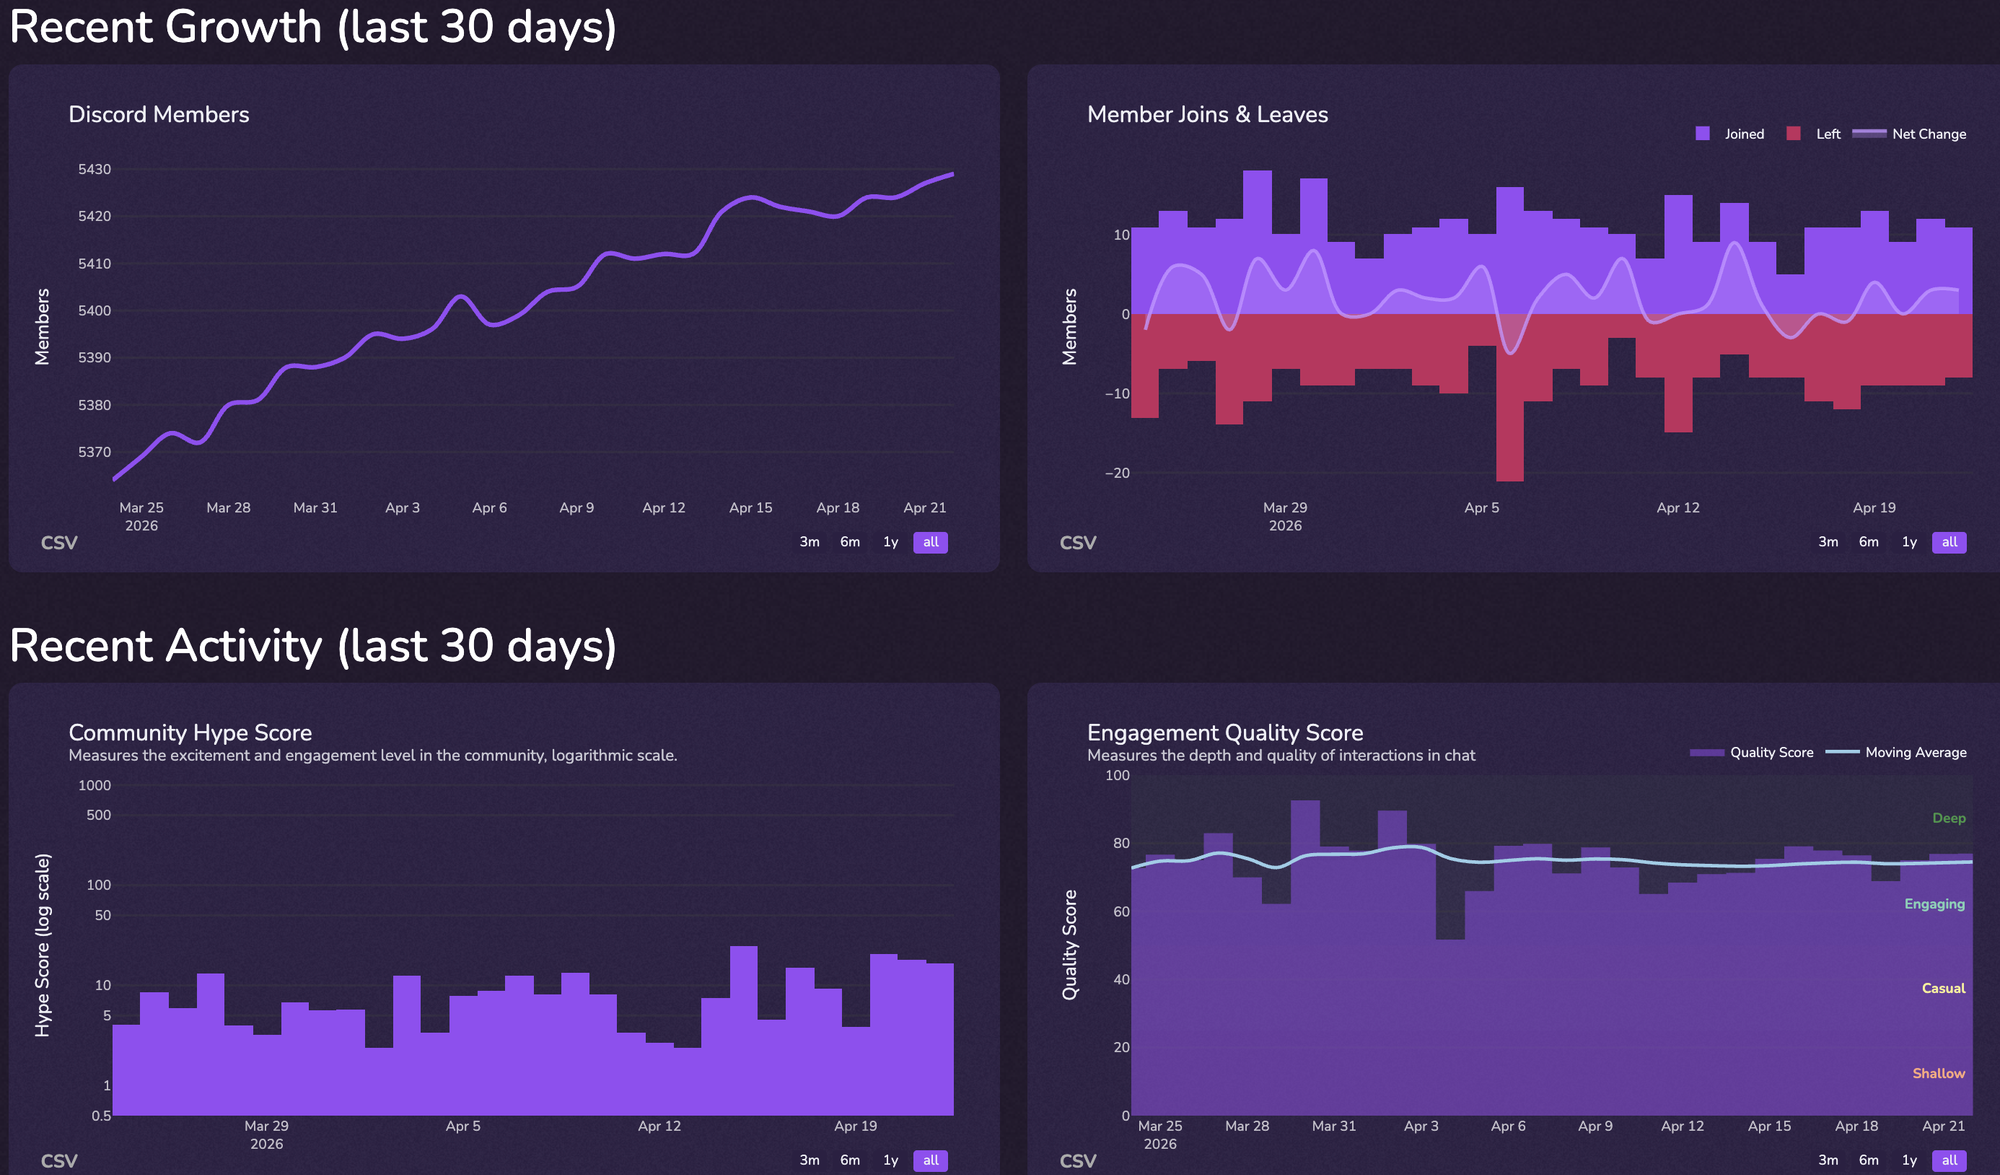
Total members. On Twitter, a follower opted in to see your content. On Discord, a member clicked an invite link and may never have returned. Discord servers routinely have 80%+ of their member count permanently inactive. Reporting "total members" upward implies that the number represents your community. It doesn't. The number you actually want is active contributors — covered below in Section 3.
Reach and impressions. This metric is so deeply baked into social reporting that teams try to recreate it on Discord. Don't. Discord has no feed and no algorithm; impressions are conceptually meaningless. The closest honest analog is who came back and chatted in the next seven days — also covered below.
Engagement rate (likes ÷ followers). Reactions feel like engagement. They mostly aren't. On Discord, a thumbs-up emoji costs 200 milliseconds of attention; a written reply costs minutes. A server with 500 reactions and 20 messages is a less healthy community than one with 50 reactions and 200 messages. The replacement metric is message per member, which captures whether members are actually talking or just clicking.
Posting frequency (your team's). Social playbooks treat posting cadence as a controllable input — post more, get more reach. On Discord this is actively counterproductive. The best Discord communities have moderators talking less than members, not more. The metric you want is what percentage of new joiners send their first message — that tells you whether your community is generating its own conversation, which is the whole point.
Follower growth. A growing follower count on Twitter is real growth, because every follower has at least signaled intent. Member growth on Discord is mostly a leaky bucket: people pour in from a campaign, glance, and leave. Without a retention number to pair it with, growth is a vanity stat that hides the leak. The replacement is a 5-minute and 7-day chat retention.
The pattern is consistent: every broadcast metric that worked on Twitter and other social media has a Discord equivalent that's narrower, harder to game, and tied to actual community health. Here are those equivalents.
The 5 Discord Analytics Metrics That Actually Matter at Scale
These are the five numbers that should replace the five above on every report that leaves your team. The benchmarks come from our analysis across the CommunityOne platform, detailed in our master Discord analytics guide.
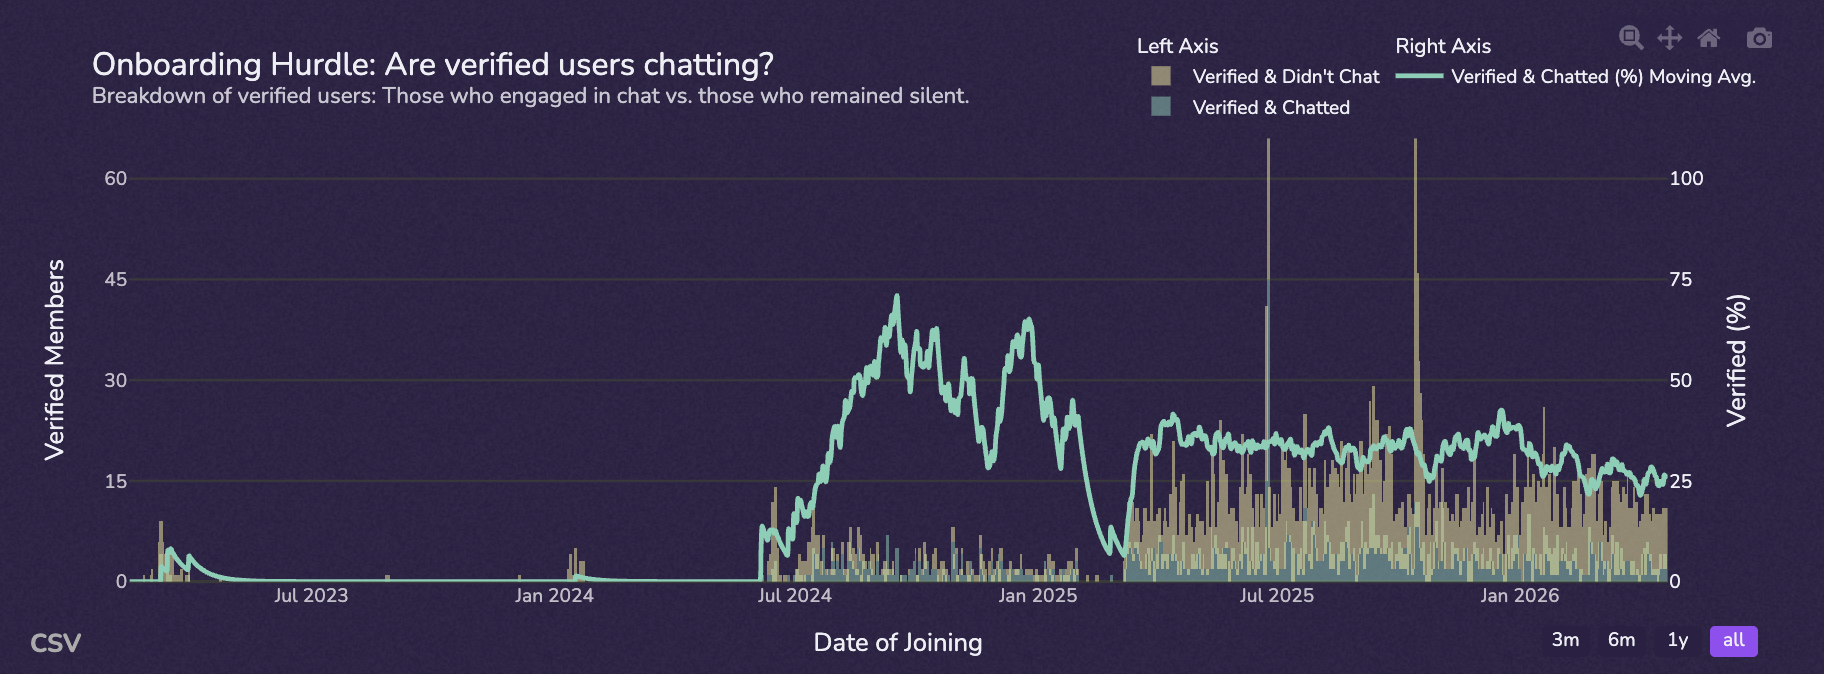
5-Minute and 7-Day Chat Retention: The Discord Analytics That Predict Onboarding
Two paired retention numbers, both about new joiners.
5-minute retention asks: of members who send their first message, what percentage are still chatting five minutes later? This is your community's reflex test. A high number means the room is alive — someone replied, the new member felt welcomed, and a conversation took shape. A low number means new members spoke into a void.
7-day chat retention asks: of members who joined this week, what percentage came back and chatted within seven days? This is the closest Discord analog to D7 retention in product analytics — a number every PM in your building already knows how to interpret.
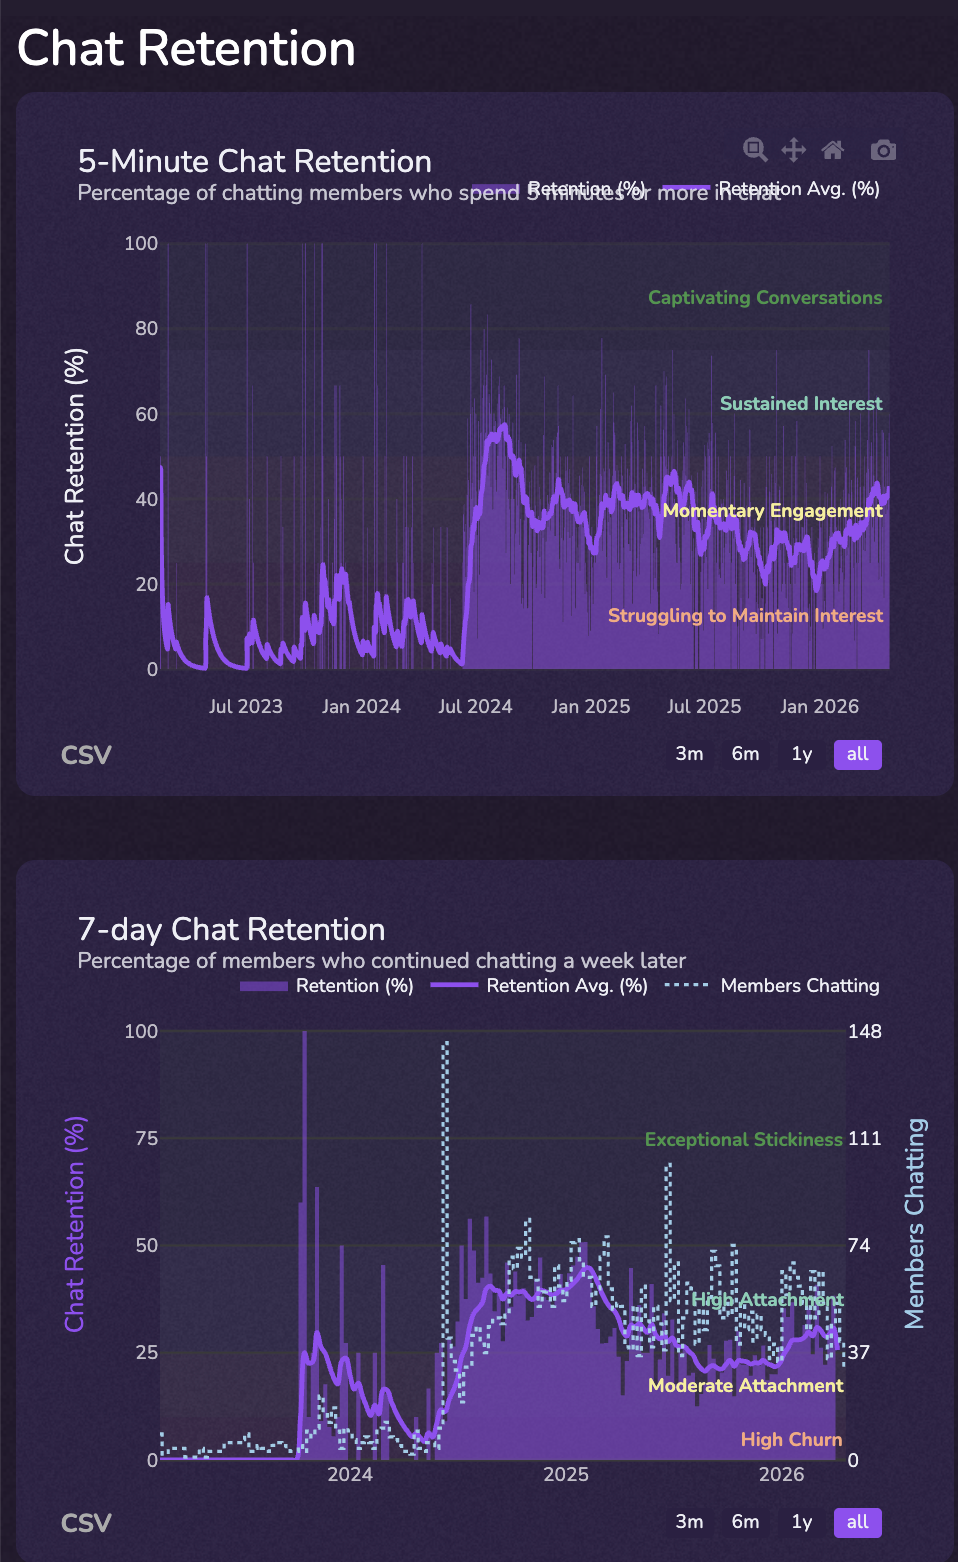
The benchmark we see consistently across the platform: if 5-minute retention drops below 20%, new members aren't getting timely responses. That's your signal to staff your community team for the hours your servers are actually busy (we've found 19:00 UTC is the global peak), or to deploy automation that fills the gap.
"5-minute chat retention below 20% means your community is understaffed during peak hours. Discord's global peak is 19:00 UTC."
Why these belong in the KPI: retention is the language product and growth teams already speak. Reporting Discord retention alongside product retention puts the channel on the same axis as everything else leadership measures, and ends the "is Discord different?" debate by speaking in their dialect.
Super Fans: The Discord Analytics Equivalent of Power Users
We call this metric "super fans," and it's measured two ways.
Count form: the number of distinct members who sent at least three messages in the last seven days. This is your weekly active contributor base — the people who actually constitute the community, as opposed to the silent majority who joined and never spoke.
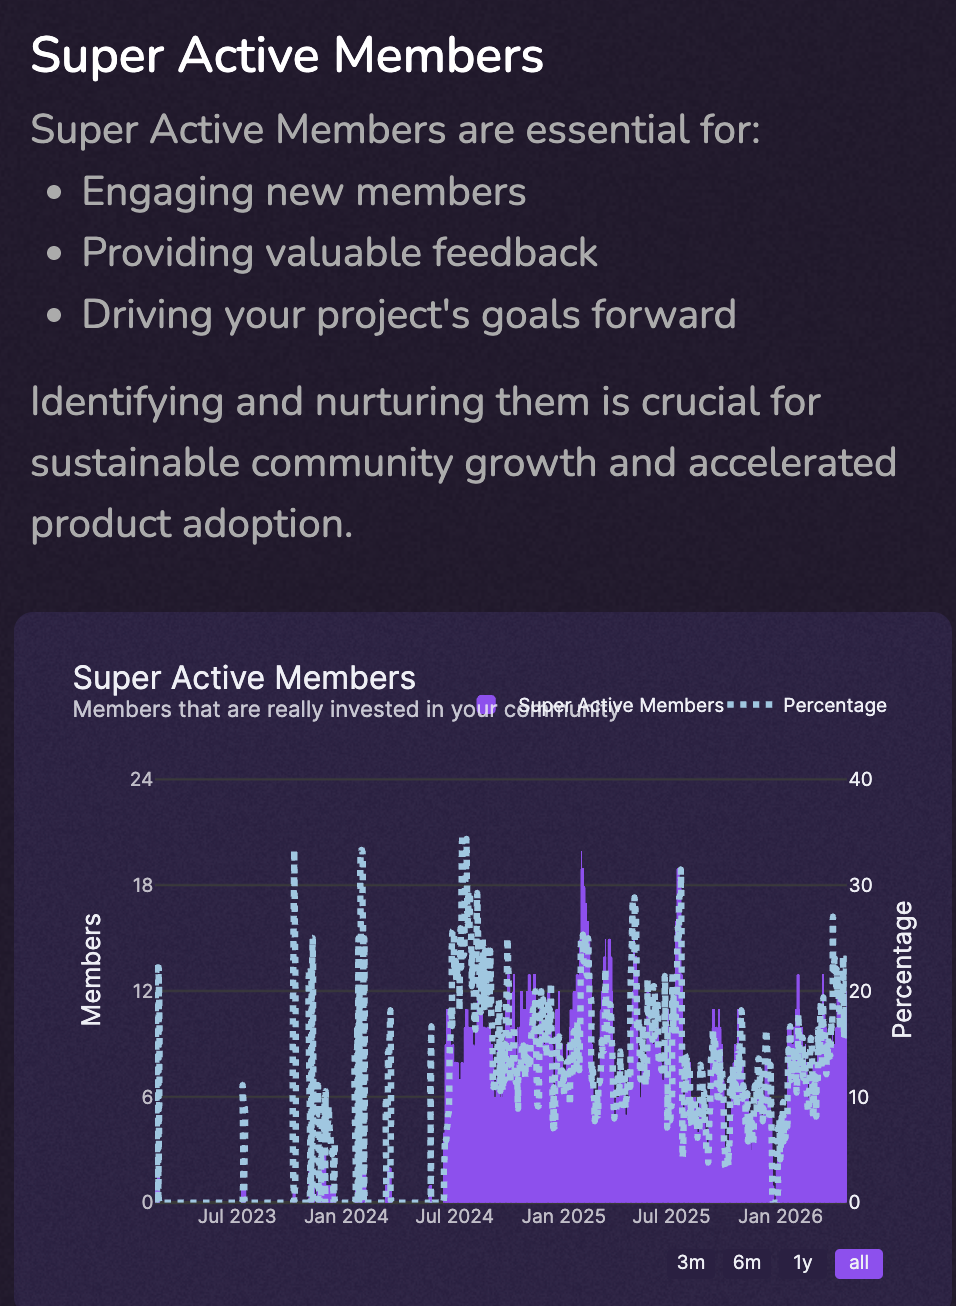
Density form: average messages per member, computed across active members. The healthy floor is above 4 messages per member; Twenty messages per member translates roughly to 40 minutes per day of voluntary attention — a number any marketing team would kill to claim about their channel.
Why this belongs in the KPI: This is your power-users equivalent. It's the board-ready number that reflects actual community-product fit, and it grows or shrinks for the same reasons superfans do — onboarding quality, content/conversation utility, retention mechanics. It plugs directly into existing growth dashboards.
Conversation Depth: Words per Message in Discord Analytics
Average words per message across all server activity. Sounds trivial. Isn't.
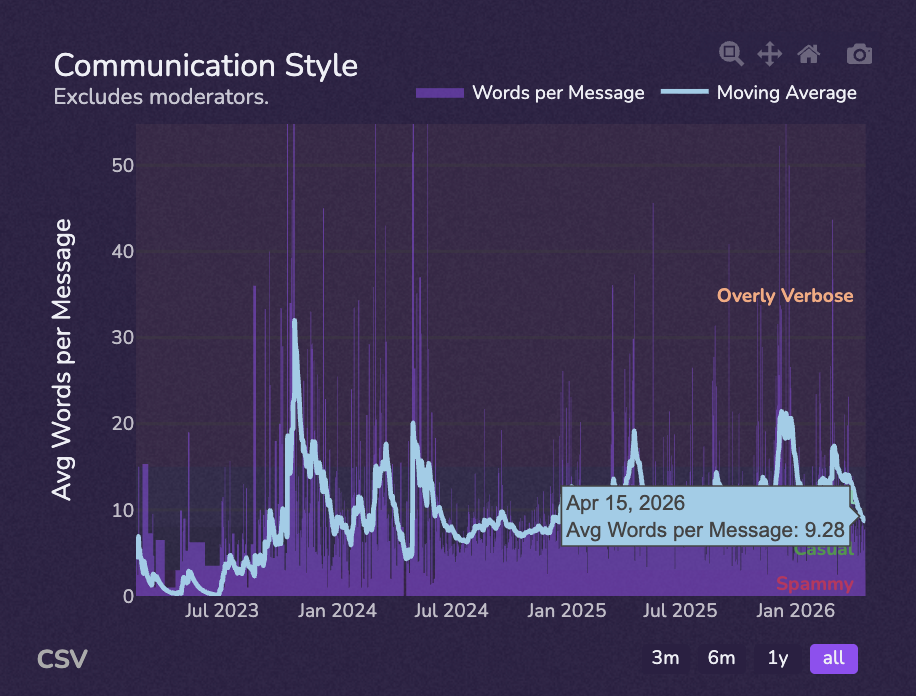
A server pumping out 1,000 messages of "gm" or single-emoji replies is a fundamentally different asset than a server pumping out 1,000 messages of substantive discussion. Both look identical on a "messages per day" chart. Words per message is the metric that separates them.
Benchmarks: Web3 communities average around 4.5 words per message; Web2 communities run closer to 7 words per message. Anything significantly under those numbers usually means the community has slid into low-effort posting (gm spam, emoji ladders, role-farm chatter), which feels like activity but doesn't compound.
"Web2 Discord communities average ~7 words per message. Web3 averages ~4.5. Anything significantly lower is gm-spam, not conversation."
Why this belongs in the KPI: This metric lets you defend community quality when leadership pushes for raw volume. "Yes, we could double messages per day by gamifying gm posts, but it would cut average words per message in half — which would tank our conversion rates downstream, here's why."
Time to First Message: The Discord Analytics Onboarding Funnel
Of verified new members, what percentage sends at least one message? This is your onboarding conversion rate — and you should treat it the same way the growth team treats sign-up funnel conversion, because it's the same shape of metric.
The most common reasons this number is low have nothing to do with the community itself: overly strict verification flows, no obvious "where do I post" channel, and welcome bots that bury the conversation under a wall of rules. Each is fixable, and each fix shows up here within a week.
Why this belongs in the KPI: it's the single leading indicator that moves every other number on this list. If time-to-first-message goes up, super fans go up, retention goes up, conversation depth goes up — usually within 30 days. This is the lever your team controls most directly, and the one most worth reporting on weekly.
Social Reach: The One Discord Analytics Metric Social Media Has No Equivalent For
How many distinct members is each active member talking to? Replies, mentions, threads — all the connections in the relationship mesh.
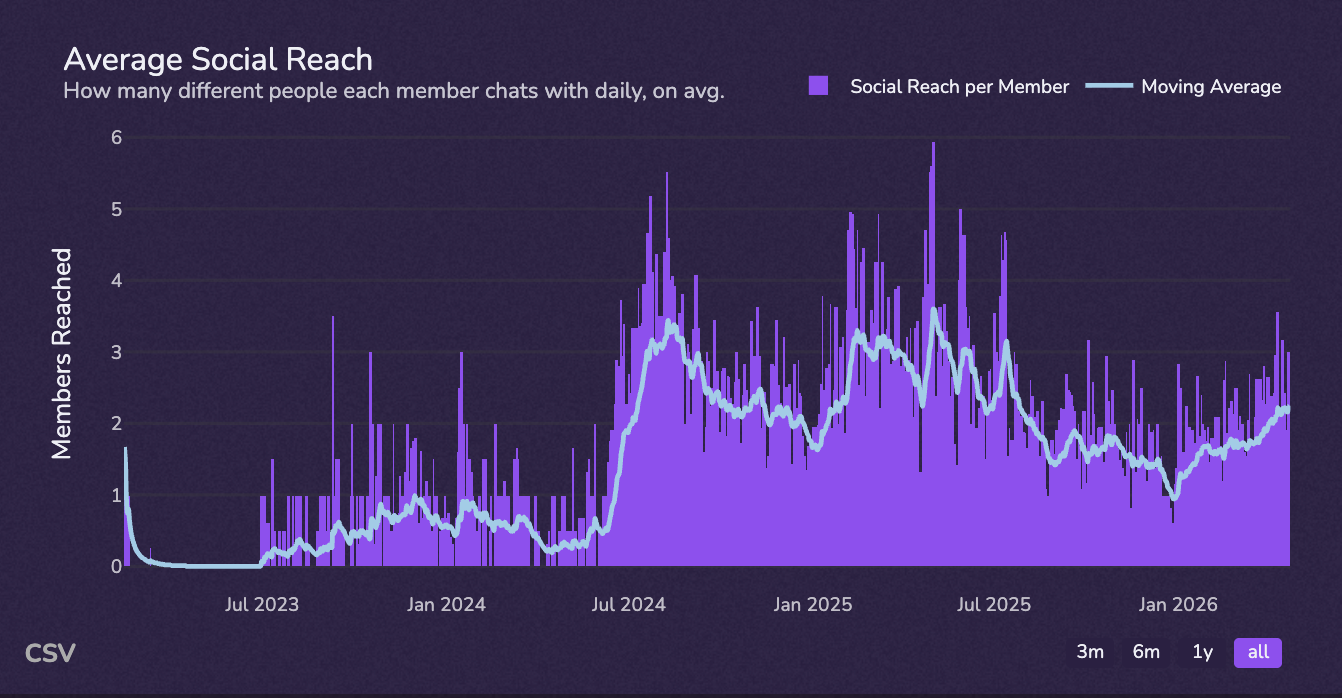
This is the metric that captures the entire thesis of this post. It has no equivalent on Twitter or Instagram, because broadcast graphs don't generate this kind of structure. It's also the metric that distinguishes a "support channel" (where everyone talks to your moderators and nobody talks to each other) from a "community" (where members talk to other members). The first kind doesn't compound. The second kind does.
Why this belongs in the KPI: it's the strongest defensive narrative your community has. A growing social reach number means your community is becoming structurally more valuable over time — every new active member adds more potential connections than the last. That's the network effect slide every PM already understands from other contexts. Speak the same language.
The Ultimate Discord Analytics Question: Does Discord Drive Product Adoption?
Everything above is internal to Discord. It tells you the community is healthy. It does not, by itself, tell your CFO whether the channel is worth the investment.
The metric that does that — the one that ends every "is Discord worth it?" conversation in a single slide — is this:
Of users who are active in your Discord, what percentage use your product, what's their retention, and how much more do they use it than non-Discord users?
Once you can answer that question with real numbers, the conversation about Discord changes permanently. It stops being "Discord costs us X" and starts being "Discord-active users have N% higher D30 retention and N× the average product sessions per week."
Most companies cannot compute this number, for one boring reason: Discord identity (user_id) lives inside Discord, and product identity (account_id) lives in your data warehouse, and the two are never joined. Every other piece of analytics infrastructure exists. The join doesn't.
The operational unlock is straightforward:
- Add a "connect your Discord" step inside your product onboarding (or, equivalently, a "connect your account" step inside your Discord). This is usually a one-engineer, one-sprint project.
- Once IDs are linked, the cohort comparison becomes a trivial SQL query in your warehouse: Discord-active vs. non-Discord users, sliced by retention, usage frequency, paid conversion, and LTV.
- Put the resulting four numbers — D30 retention, weekly sessions, paid conversion, NPS — in the Discord section of every KPI, with both cohorts side by side.
We've seen what this looks like in production. When we analyzed over 20,000 data points across servers using our Hype Engine product, the cohort of members who completed even a single quest had an 80% retention rate — the kind of number that, once you can attribute it back to your product funnel, ends every "is Discord worth the investment?" debate. The same analysis surfaced a second insight worth stealing: it takes roughly 10% of daily server messages mentioning a product before adoption visibly accelerates. That's a measurable input, not a vibe — and it's the kind of attribution that only works once you've done the ID join.
"Discord-to-product adoption visibly accelerates once ~10% of daily server messages mention the product."
This is the slide that wins community-team budget conversations. Everything else in this post supports it.
The Mental Model Shift for Enterprise Discord Analytics
Stop measuring your community like a Twitter account. Start measuring it like two things at once: a product (with users, retention, depth-of-use) and a city (with residents, regulars, contributors, and mayors).
A city is not measured by how many addresses it has. It's measured by who shows up to do things in it — who lives there full time, who runs the shops, who organizes the block parties, who knows their neighbors. Member count is the address count. Active contributors are the residents. Super fans are the shop owners. Mods are the mayors.
The contrast, at a glance:
| Broadcast brain (legacy) | Product/community brain (correct) |
|---|---|
| Members | Active contributors |
| Posts per week (your team's) | Message per member (everyone's) |
| Reach | Social reach (member ↔ member) |
| Conversion of campaign click | Conversion of new member → first message |
| Followers | Connected accounts (Discord ID ↔ product ID) |
If a metric on your current Discord report is in the left column, replace it with the metric in the right column before your next leadership meeting. Every column-shift on this table moves your Discord narrative from "vanity surface" to "compounding asset."
Quick Wins for Your Discord Analytics Stack
Three things to ship in the next 30 days, in order of leverage:
1. Replace member count with Discord daily active users in every leadership-facing report. This is a one-meeting change. Pull the new number, swap the chart, and write a one-paragraph note explaining why. The number will be smaller. That's the point — it will also be defensible, and it will move predictably with the levers your team controls.
2. Link Discord IDs to product accounts. This is the unlock for Section 4 above. One sprint, one engineer, an opt-in connect flow on either side. After this ships, every report your team produces gets dramatically more credible upward, because every claim about Discord can be cross-checked against product data.
3. Add 5-minute retention and % of verified users chatted to your weekly community dashboard. They're the leading indicators that move every other number on this list, and they're cheap to track. If you're using CommunityOne Analytics, both are surfaced by default in the Engagement/Server Setup tab.
The Number That Wins Budget
Your Twitter follower count was performance art. Your Discord member count is too. The number that wins the community-team budget is the one that proves your community changes how people use your product — and you can only get that number once you stop reporting Discord like it's social media.
The five metrics in Section 3 give your team an honest read on community health. The Section 4 question — Discord-active vs. non-Discord product behavior — gives your leadership team an honest read on whether the channel is worth the investment. Together, they replace the entire vanity stack you inherited from your last social media report.
Three places worth going next:
- For metric definitions and platform-wide benchmarks: Master Discord Analytics: Boost Your Community Engagement.
- For the KPI checklist (verification rates, bot detection, single-message engagement): Leveraging Discord Analytics: A KPI Checklist for Scaling Effectively.
- For the next layer down — measuring the people who run the community itself: Tracking Discord Mod Performance: 6 Essential Metrics.